Since mid-March, the State of Ohio’s Covid-19 statistics have been recorded daily. Following is a summary of data related to Covid-19 infection rates.
Days to doubling Covid-19 infection rates (ie, the length of time before infection rates double again) have soared (Figure 1). This is due to the significant drop off in the number of reported Covid-19 infections.
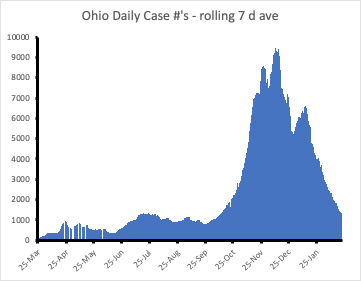
Covid-19 positive infections peaked in December, 2020 (Figure 2). Covid-19 positive infections have dropped significantly since that time. Current Covid-19 infection levels are similar to those in July, 2020.
Many possible reasons exist for this dramatic slowdown in infections. First, it’s possible society has become more aware of disease transmission and personal habits have changed. Second, viruses tend to mutate over time. It is possible that current strains have become less infectious. This is somewhat unlikely since most strains, as a natural means of survival, mutate to become more infectious but less virulent (severity of the disease). Third, it is possible that the actual numbers of Covid-19 positive infections have always been higher than reported. This is supported by the fact that when groups of people are tested for Covid-19 a number of otherwise asymptomatic people test positive. This leads to a fourth possibility for the slowdown in infections: herd immunity is beginning to take place. It is reasonable to believe that many people in society already had Covid-19, then developed immunity, and now are “part of the herd” making the transmission of Covid-19 much more difficult than previously.
The strange behavior of Covid-19 having a severe impact on some persons while a mild or no impact is experienced by many others has rightfully concerned many people. But the possibility of approaching herd immunity will lessen disease risk to all people including the most vulnerable, elderly and otherwise compromised.
Figure 1. Days to Doubling of Covid-19 Infections in Ohio
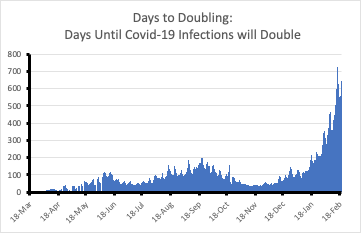
Figure 2. Covid-19 Infection Rates Have Fallen Dramatically in Ohio