To say we are in unprecedented times has become a bit of a cliché or at least redundant statement. The Covid-19 pandemic has literally caused cultures around the world to change in ways most people have never experienced before.
This past two+ weeks we at Microbiome Nexus have been tracking the “local” incidence of Covid-19. Local, meaning Ohio where Microbiome Nexus is based out of.
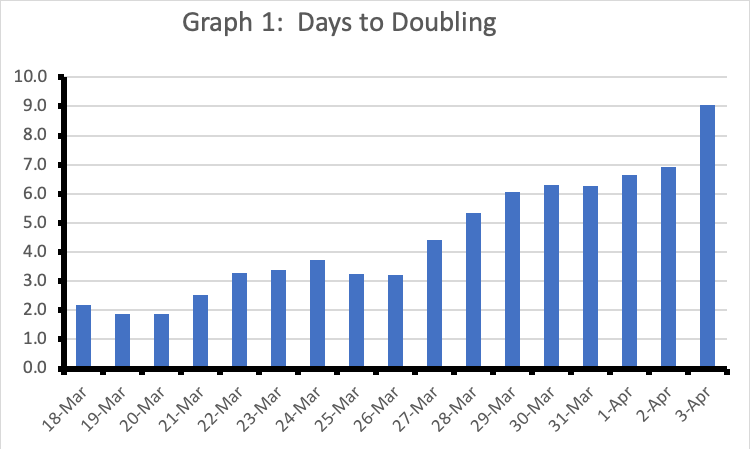
Interestingly, Graph 1 shows a steady increase in the “Days to Doubling” trend has occurred during the past couple of weeks.

To explain, Days to Doubling is what we calculate as the number of days until the confirmed cases double. The data have been daily gathered from Ohio’s reported Covid-19 number found here:
https://coronavirus.ohio.gov/wps/portal/gov/covid-19/home
What the increase in Days to Doubling shows is that it’s taking longer for the population of Ohio to double in the number of confirmed Covid-19 cases. This is good. We want to increase this number more towards infinity as this shows a decreased rate of Covid-19 infection.
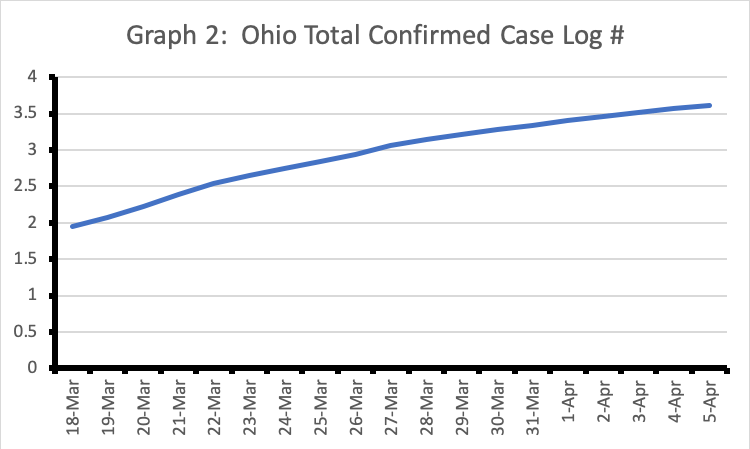
In Graph 2 the logarithmic number of Covid-19 cases in Ohio is reported. This graph is starting to show a logarithmic curve of the reported cases. We want to see this curve flatten out even more.
Graph 3 indicates the number of daily confirmed cases. Until today, April 5th, this had steadily been increasing. Will today’s decrease continue to occur going forward? Only time will tell.

Are Ohioans “out of the woods” on Covid-19? No, unfortunately not. So long as we still are seeing the incidence rate going up, the disease is still “winning.” But, for now Ohioans can take heart in the social distancing, stay at home directive, and related practices are helping to slow the disease progression. Hopefully this serves as a bit of inspiration not only for Ohioans but also for any other areas contemplating whether or not social distancing or other such modified behaviors are actually beneficial, because in Ohio they are apparently working!
